Flood and Drought Data
Four
Mile Run is a direct tributary of the Potomac River. The Potomac River Basin
cradles the Four Mile Run watershed and ultimately drains it to the Chesapeake
Bay. Four Mile Run rises in Fairfax County and flows downstream through the
City of Falls Church and on to Arlington County. The final 2.3 miles of the
run, before it opens to the Potomac River, are contained in a flood control
channel designed in the early 1970s by the US Army Corps of Engineers (USACE). Although
a USGS monitoring station within the Lubber Run and Doctor’s Branch watersheds
could not be located, the USGS 1652500 gaging station on Four Mile Run located
at the Shirlington Road Bridge has collected stream flow data since 1951.


The location of the gage allows capture of flow data from a 13.80 square mile sub-basin of the watershed, about 70% of the entire watershed (USGS website). Although the lower portion of Four Mile Run is impacted by the tidal influence of the Potomac River, the USGS gage location is roughly 6,000 feet upstream of the extent of those impacts.

Collapse of the Walter Reed Bridge in Arlington County – Just Upstream of the USGS Gaging Station. Flooding on June 22, 1972 was due to the remnants of Hurricane Agnes.
The USGS website provides continuous stream-flow, precipitation and temperature records which can be found in the graphs below:


Also, the information on National Weather Service website indicates that the latest observed water level in four mile run is 4.14 ft at 12:25 PM EDT 7-Oct-2020 and flood stage is 12 ft.


Historic Flood Crests
|
- |
Water Year |
Date |
Gage Height (ft) |
|
1 |
2006 |
06/25/2006 |
20.20 |
|
2 |
2019 |
07/08/2019 |
15.30 |
|
3 |
1975 |
09/26/1975 |
13.07 |
|
4- Hurricane Agnes |
1972 |
07/21/1972 |
12.40 |
|
5 |
2018 |
09/01/2018 |
12.26 |
|
6 |
2003 |
09/23/2003 |
11.83 |
|
7 |
2011 |
09/08/2011 |
11.29 |
|
8 |
2008 |
09/06/2008 |
11.19 |
|
8 |
1985 |
09/10/1985 |
10.36 |
|
9 |
1993 |
11/28/1993 |
10.23 |
|
10 |
2011 |
09/08/2011 |
10.13 |
|
11 |
1987 |
06/26/1987 |
10.12 |
|
12 |
2000 |
06/22/2000 |
9.79 |
|
13 |
1990 |
10/23/1990 |
9.66 |
|
14 |
2004 |
09/28/2004 |
9.29 |
|
15 |
2005 |
06/29/2005 |
9.28 |
|
16 |
2009 |
05/29/2009 |
9.03 |
|
17 |
2001 |
05/22/2001 |
9.01 |
|
18 |
1992 |
07/24/1992 |
8.90 |
|
19 |
1999 |
06/14/1999 |
8.58 |
|
20 |
2007 |
06/13/2007 |
8.56 |
|
21 |
1974 |
08/30/1974 |
8.55 |
|
22 |
1990 |
05/09/1990 |
8.38 |
|
23 |
1979 |
09/05/1979 |
8.36 |
|
24 |
1989 |
05/05/1989 |
8.25 |
|
25 |
1982 |
06/01/1982 |
8.20 |
|
26 |
1986 |
07/20/1986 |
8.15 |
|
27 |
1992 |
11/23/1992 |
8.10 |
|
28 |
2010 |
06/28/2010 |
8.01 |
|
29 |
2011 |
09/07/2011 |
8.00 |
|
30 |
1981 |
07/04/1981 |
7.96 |
|
31 |
1998 |
09/22/1998 |
7.94 |
|
32 |
1983 |
06/21/1983 |
7.92 |
|
33 |
1984 |
03/29/1984 |
7.90 |
|
34 |
1988 |
05/06/1988 |
7.87 |
|
35 |
1979 |
10/01/1979 |
7.49 |
|
36 |
2002 |
04/19/2002 |
7.48 |
|
37 |
1992 |
03/08/1995 |
7.28 |
|
38 |
2010 |
01/19/1996 |
7.18 |
|
39 |
2011 |
09/06/2011 |
7.02 |
|
40 |
1981 |
03/10/2011 |
6.85 |
|
41 |
1998 |
03/06/2011 |
6.84 |
|
42 |
1983 |
08/28/2011 |
6.73 |
|
43 |
1984 |
04/17/2011 |
5.76 |

Four Mile Run flooding, 1960s
It
is apparent from the table that there is a grouping of flooding events during
the late 1960s and early 1970s. In recent years, particularly the summers of
2018 and 2019, brief, intense rains have caused flash flooding and significant
property loss. The impact of flash floods like those in 2006 and 2019 can
equal or exceed that of a hurricane requiring state and national emergency
declarations. On July 8, 2019, rain fell fast and hard. Arlington suffered
flood damage in the millions of dollars and declared a local state of emergency.


Flood damage, Arlington, 2006
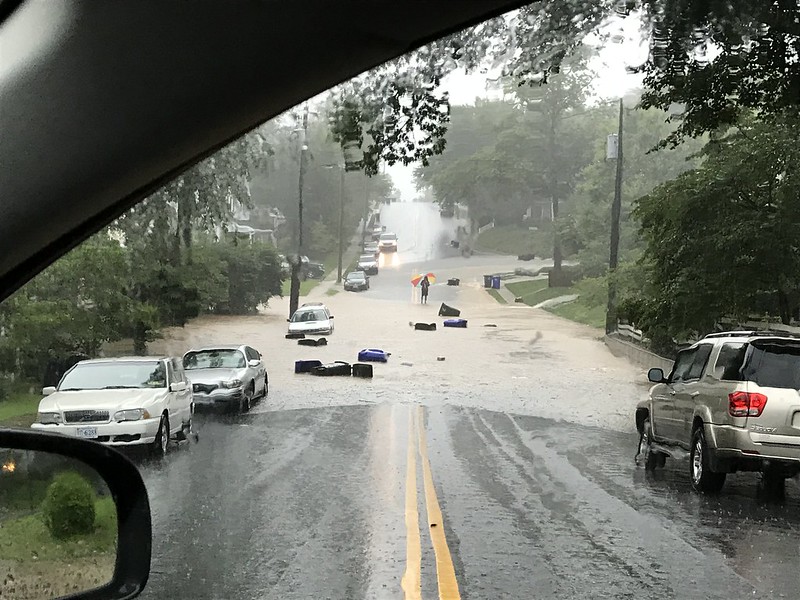
Flood damage, Arlington, 2019
Based on the map below, Lubber Run suffered severe flood damage on July 8 in comparison to the doctor’s branch which suffered less damage.

Flood in Media
Videos capturing the July 8 2019 flood’s ferocity are:
https://www.youtube.com/watch?v=AB9QNP1rh7Q
https://www.youtube.com/watch?v=Y3rbANh1QaM
Drought Data
The U.S. Drought Monitor (USDM) is a map that shows the location and intensity of drought across the country. The data is updated each Tuesday and released on Thursday. This map shows the Virginia state drought conditions on October 06, 2020, and it is obvious that the Four Mile Run watershed is not currently in a Drought.

Drought History in Virginia
from 2000-2020
Since 2000, the longest duration of drought (D1-D4) in Virginia lasted 103 weeks beginning on May 1, 2007 and ending on April 14, 2009. The most intense period of drought occurred the week of August 20, 2002 where D4 affected 30.53% of Virginia land. (USDM)


Comments
Post a Comment