Flood Plain Maps and Alluvial Soils
USDA's Web Soil Survey Online: Web Soil Survey (WSS) provides soil data and information produced by the National Cooperative Soil Survey. It is operated by the USDA Natural Resources Conservation Service (NRCS) and provides access to the largest natural resource information system in the world. I defined an area boundary of Lubber Run watershed, as a part of bigger Four Mile Run watershed, as my area of interest on the map.
The soil map section bellow includes the soil map for the defined area of interest, a list of soil map units on the map and extent of each map unit, and cartographic symbols displayed on the map. Also presented are various metadata about data used to produce the map, and a description of each soil map unit.


By exploring the soil data tab, I found the map of flooding frequency which shows the temporary inundation of an area caused by overflowing streams, by runoff from adjacent slopes, or by tides. In this map frequency is expressed as none meaning that the chance of flooding is nearly 0 percent in any year. Flooding occurs less than once in 500 years.


Water Management interpretations are tools for evaluating the potential of the soil in the application of various water management practices. Example interpretations include pond reservoir area, embankments, dikes, levees, and excavated ponds.
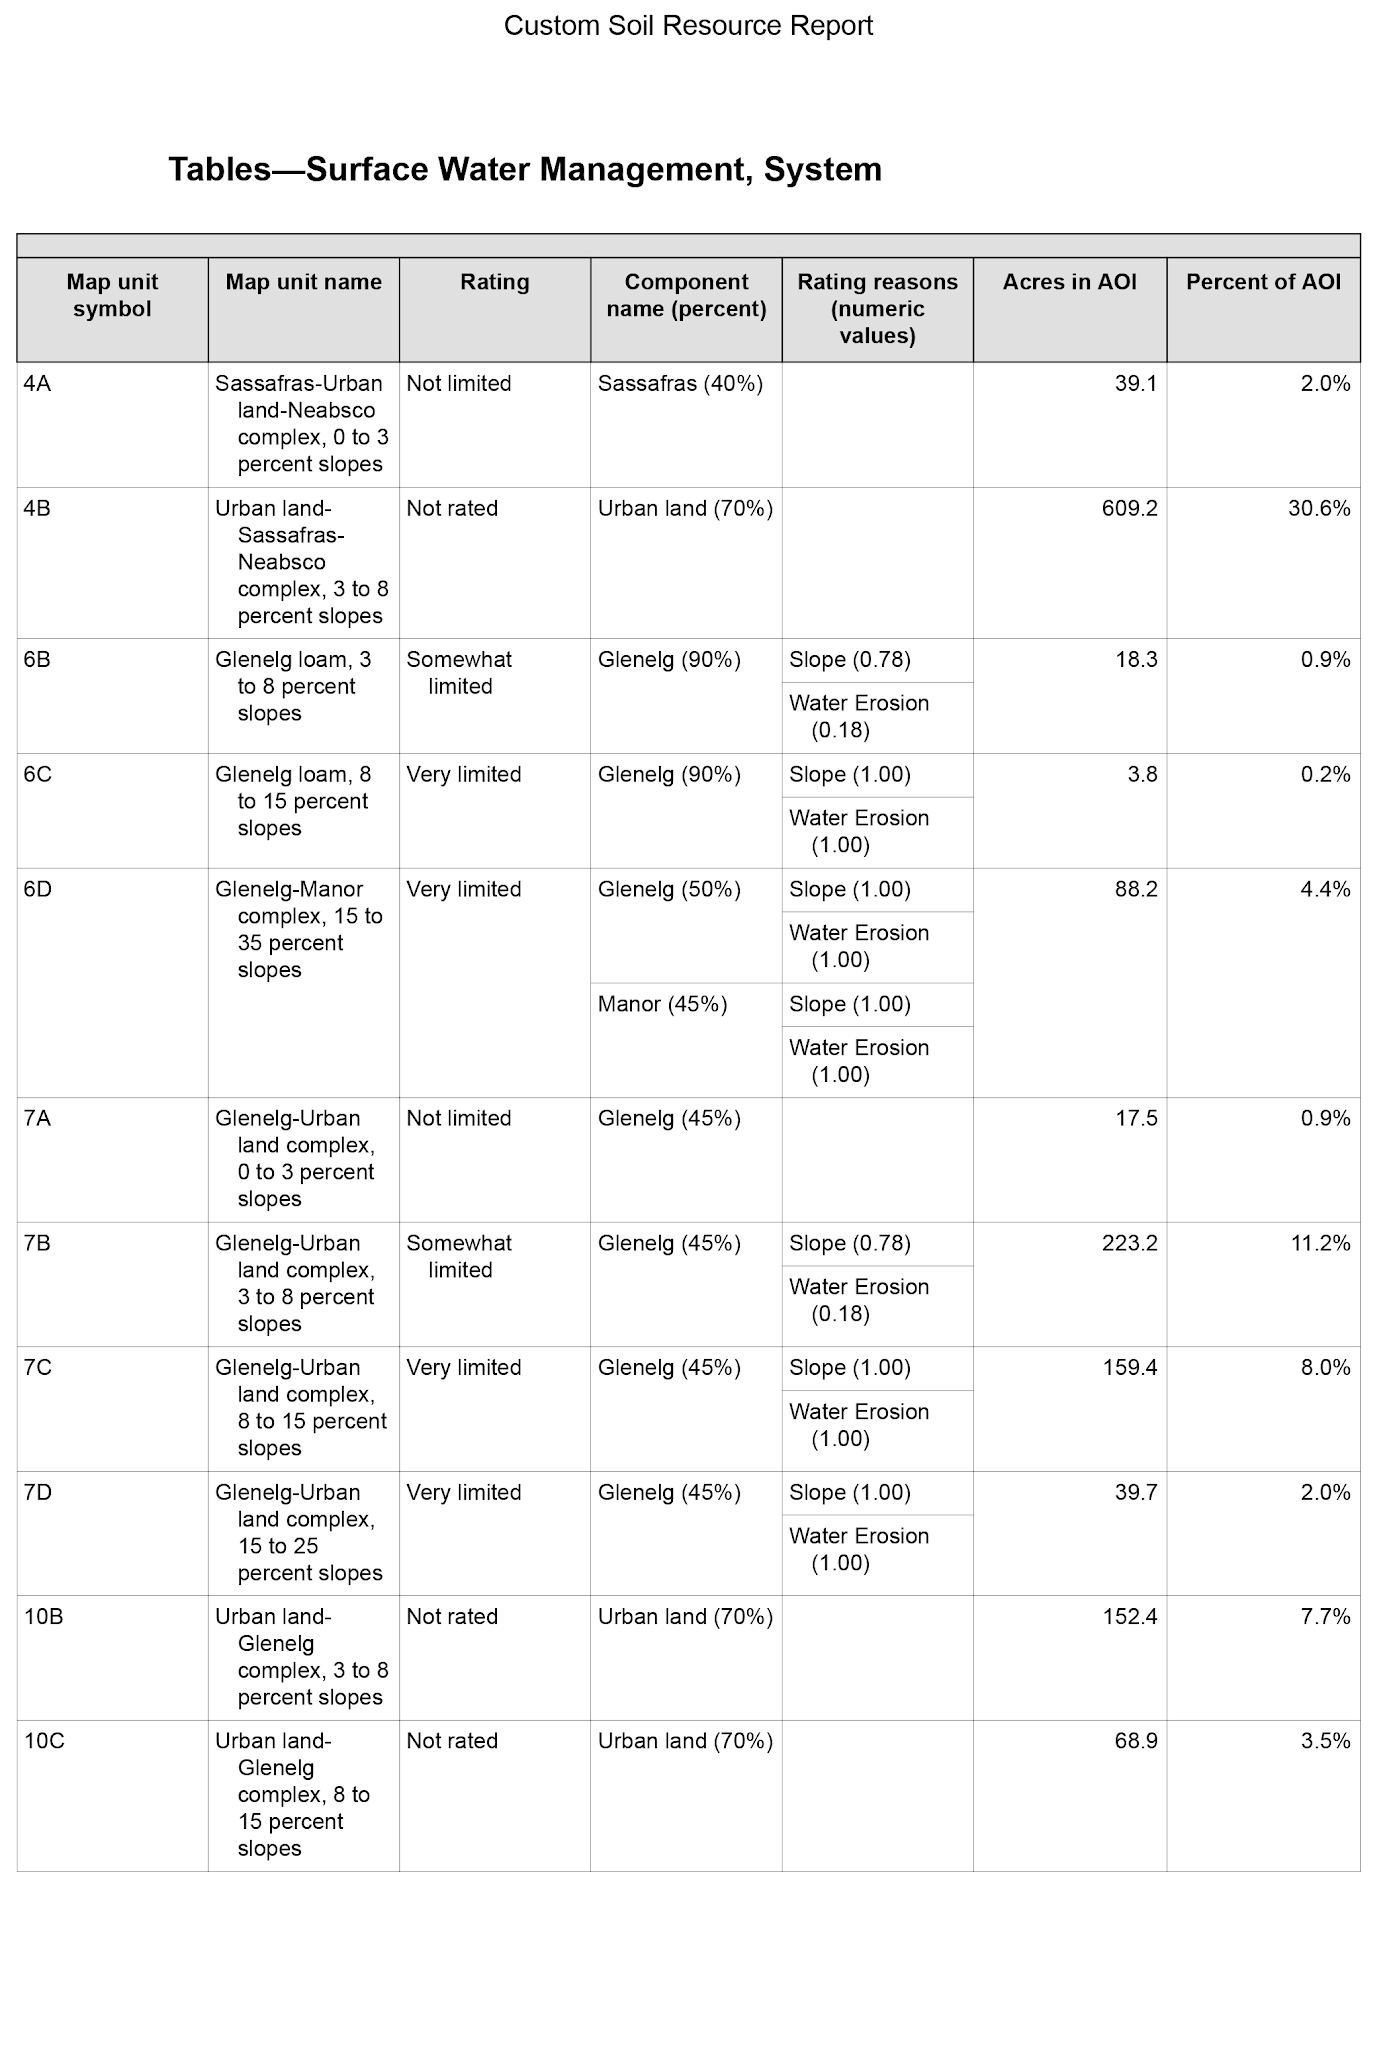
The ratings for Surface Water Management, System are based on the soil properties that affect the capacity of the soil to convey surface water across the landscape. Factors affecting the system installation and performance are considered. Water conveyances include graded ditches, grassed waterways, terraces, and diversions. The ratings are for soils in their natural condition and do not consider present land use. The properties that affect the surface system performance include depth to bedrock, saturated hydraulic conductivity, depth to cemented pan, slope, flooding, ponding, large stone content, sodicity, surface water erosion, and gypsum content.


FEMA Flood Mapping Tools: The National Flood Hazard Layer (NFHL) is a geospatial database that contains current effective flood hazard data. FEMA provides the flood hazard data to support the National Flood Insurance Program. You can use the information to better understand your level of flood risk and type of flooding.
This map bellow shows the flooding hazard layer in Four Mile Run at Lubber Run.


Comments
Post a Comment